
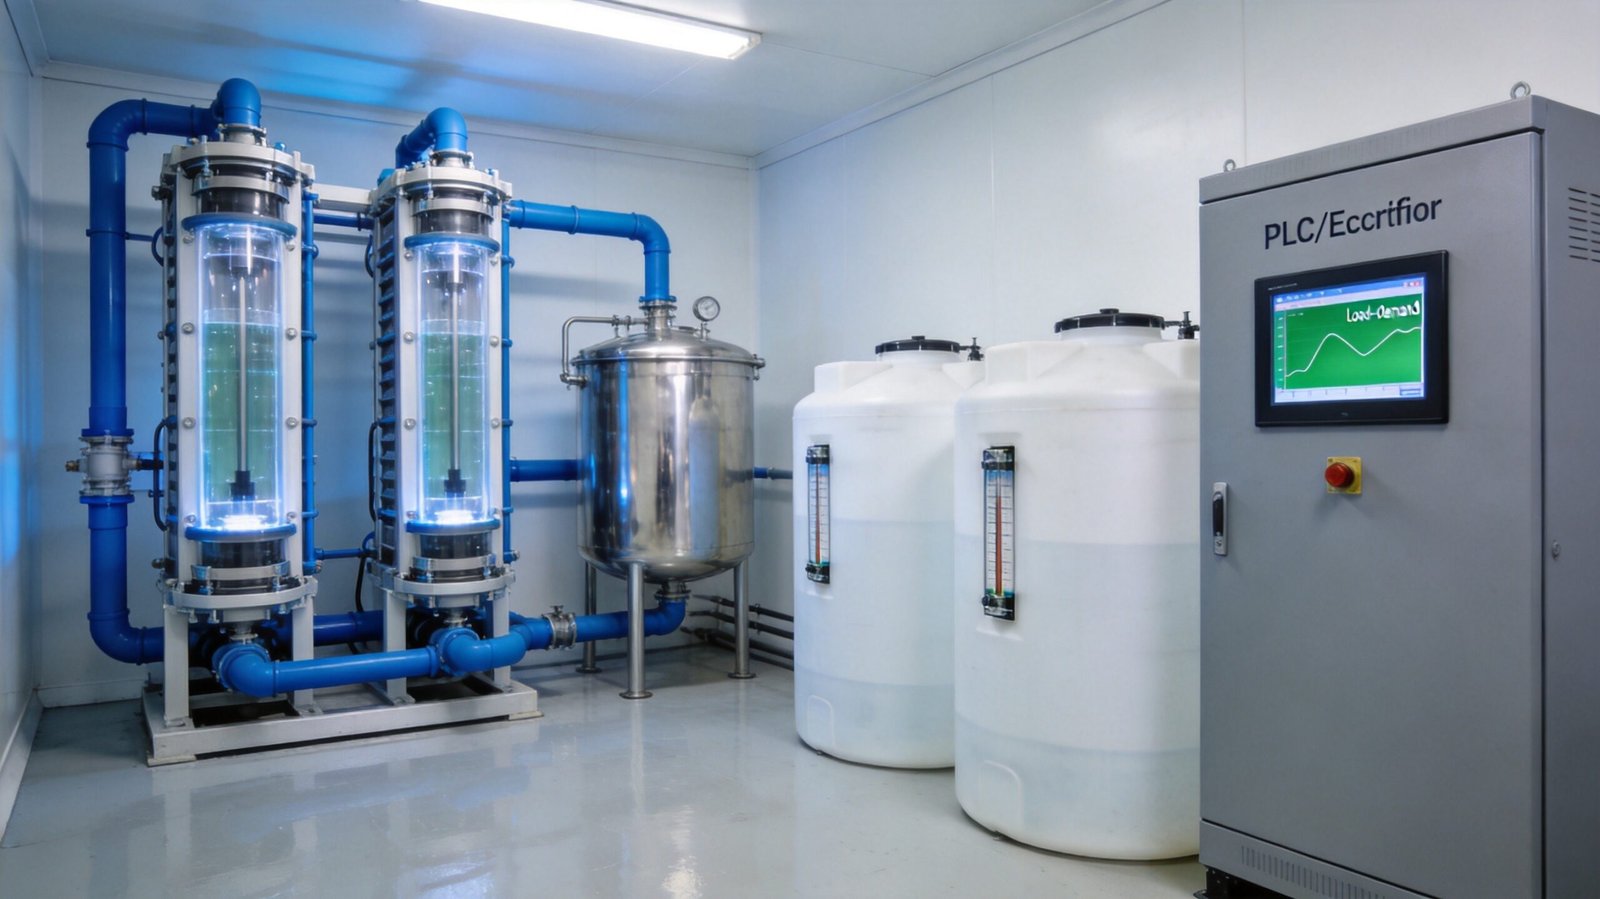
Almost no chlorine demand curve is flat. A municipal plant draws 40% more hypochlorite on a hot weekend than on a cold Tuesday. A power station runs full output for five summer months and idles the rest of the year. A food plant shocks its wash water for two hours per shift and needs nothing in between. The sodium hypochlorite generator turndown ratio — rated output divided by the lowest output the equipment can hold continuously and still meet its performance guarantees — decides whether a plant follows that curve smoothly or spends its life fighting it. It is also the specification most often written vaguely in a purchase order and most often regretted in year two. This guide covers how much turndown membrane-cell generators genuinely deliver, what degrades below half load, how to size buffer storage against a real profile, and how to specify and test the number.
Table of Contents
- What the Turndown Ratio Means for a Membrane Electrolyzer
- How Much Turndown Real Duties Actually Need
- Three Ways to Match Demand: Modulate, Cycle, Stage
- What Happens Inside the Cell Below 50% Load
- The Part-Load Energy Penalty
- Buffer Storage Sizing: The Arithmetic
- Control Architecture That Makes Load-Following Work
- Specifying Turndown in the Purchase Order
- Three Reference Cases
- Frequently Asked Questions
What the Turndown Ratio Means for a Membrane Electrolyzer
A 10 kg/h generator that holds a stable 3 kg/h without losing concentration, current efficiency or chlorate compliance has a 3.3:1 turndown ratio. The definition sounds trivial until you ask which limit you are quoting, because three independent constraints sit behind the number and the lowest one governs:
- Electrical turndown. The transformer-rectifier set must control current smoothly from 100% down to the minimum. Thyristor (SCR) rectifiers regulate well to 20–25% of rated current; below that, ripple and power factor degrade. Switch-mode (IGBT) units hold accuracy over a wider band.
- Electrochemical turndown. Current efficiency depends on current density. Below roughly 1.2–1.5 kA/m², the share of charge going to oxygen and chlorate rises steeply and the product falls out of the 10–15% band. This limit usually binds, and it is chemistry, not controls.
- Hydraulic and thermal turndown. Brine metering must stay proportional and measurable, anolyte circulation must keep the membrane wetted and the cell temperature uniform, and the cooling loop must reject heat without short-cycling the chiller.
An honest figure for a high-concentration membrane generator on softened saturated brine is 3:1 to 4:1 continuous turndown, with the floor set by current density rather than the rectifier. Claims of 10:1 or “infinite” turndown on a single train almost always describe on/off cycling into a buffer tank — a good strategy, but a different one with different costs. That is why the sodium hypochlorite generator turndown ratio should never be accepted as a bare ratio: it means nothing without the operating point attached.
How Much Turndown Real Duties Actually Need
Start from the demand profile, never from the annual average.
| Duty | Typical peak:minimum | Dominant driver | Usual solution |
|---|---|---|---|
| Municipal drinking water | 1.5:1 – 2.5:1 | Diurnal flow and temperature | Modulation, single train |
| Power plant cooling water | 4:1 – 8:1 | Seasonal biofouling pressure | Staging + seasonal shutdown |
| Wastewater disinfection | 2:1 – 3:1 | Wet-weather flow, effluent quality | Modulation + residual trim |
| Food and beverage sanitation | 5:1 – 10:1 | Shift pattern, CIP cycles | Cycling into buffer storage |
A useful rule before sizing anything: if more than about 30% of annual operating hours fall below 40% of peak demand, continuous modulation alone will be expensive to run and hard on the stack. That profile wants staging or a buffer, and the buffer volume usually costs less than the extra turndown does.
Three Ways to Match Demand: Modulate, Cycle, Stage
There are only three mechanisms, and most good plants combine two of them. Which one you choose determines the sodium hypochlorite generator turndown ratio you actually need to buy.
1. Modulation. The PLC trims rectifier current continuously to hold a production setpoint from flow and dose. Simple, no storage, product always fresh. Works to about 40–50% of rated output.
2. Cycling with buffer storage. The generator runs near design point for a block of hours, then stops, and the tank absorbs the mismatch. Efficiency and product quality stay at their best because the cell always runs near design current density. The cost moves to storage volume, venting and product ageing.
3. Staging. Two or more smaller trains share the duty; lead/lag rotation balances membrane hours and one can be isolated for cleaning without losing capacity. Higher capital cost per kg/h, far better part-load efficiency, because each running train sits near its design point.
| Criterion | Modulation | Cycling + buffer | Staging |
|---|---|---|---|
| Practical span | 2:1 – 4:1 | 10:1 and beyond | 2:1 – 8:1 with 2–3 trains |
| Energy at low demand | +20 to +45% below 30% load | Near design | Near design |
| Product quality | Below 10% at deep turndown | Consistent 12–15% | Consistent 12–15% |
| Membrane stress | Low, gentle | Thermal cycling | Low, more seals |
| Best fit | 1.5:1 – 3:1 smooth curves | Batch and shift duties | Seasonal swing, N+1 |
What Happens Inside the Cell Below 50% Load
Production is strictly proportional to current — Faraday’s law does not negotiate. Halving current halves the chlorine generated but does not halve the side reactions.
Current efficiency falls. At the design point of 3.5–4.5 kA/m² a well-run membrane cell converts 88–92% of charge into available chlorine. At 1.2 kA/m² that drops to roughly 78–82%, and at 0.8 kA/m² to around 75%. The lost charge becomes oxygen at the anode and hydrogen at the cathode, plus chlorate in the anolyte.
Chlorate rises. Chlorate forms when hypochlorite is oxidized further at the anode or reacts with hypochlorous acid in the bulk; both pathways are favoured by long residence time at low anolyte velocity and by low current density. A plant running continuously at 25–30% load typically shows chlorate in the product two to five times higher than the same plant at design load — which matters wherever finished water must respect disinfection by-product limits such as those summarised in the EPA Stage 1/2 DBP rules and the WHO Guidelines for Drinking-water Quality.
Product strength drops out of specification. Most high-concentration stacks hold 12–15% down to about 50% load, deliver 10–11% at 40%, and fall to 8–9% at 25%. If the process needs 12% for storage stability, deep turndown silently breaks the guarantee — see why high-concentration hypochlorite decomposes faster.
Two mechanical effects complete the picture. Thermal cycling between full load and standby causes differential expansion between membrane and frame, and stacks cycled several times an hour age faster than stacks held steady. Cut anolyte circulation too far to save energy and the membrane can dry locally at the top of the cell — irreversible, as described in our article on ion exchange membrane degradation.
The Part-Load Energy Penalty
Here is a counter-intuitive point: the cell specific energy of a membrane chlorinator barely changes with load, because cell voltage falls as current density falls. What destroys part-load economics is the auxiliary load — cooling, pumps, controls, instrument air, brine preparation — which is nearly fixed. Typical 10 kg/h unit, per kilogram of available chlorine:
| Load | Output (kg/h) | Current density (kA/m²) | Cell voltage (V) | Current efficiency | Cell kWh/kg | Auxiliary kW | System kWh/kg |
|---|---|---|---|---|---|---|---|
| 100% | 10.0 | 4.0 | 3.45 | 90% | 2.90 | 7.6 | 3.66 |
| 75% | 7.5 | 3.0 | 3.30 | 89% | 2.80 | 5.8 | 3.58 |
| 50% | 5.0 | 2.0 | 3.15 | 86% | 2.77 | 5.0 | 3.77 |
| 30% | 3.0 | 1.2 | 3.05 | 81% | 2.85 | 4.8 | 4.45 |
| 20% | 2.0 | 0.8 | 3.00 | 75% | 3.02 | 4.7 | 5.37 |
Two conclusions follow. Between 50% and 100% load the system sits within about 5% of its best specific energy, so modulating inside that band is essentially free. Below 30% the penalty climbs to 20–45%, and at 20% the plant spends nearly half again as much electricity per kilogram as at design — the quantitative case for cycling rather than modulating when demand stays low.
This is where the sodium hypochlorite generator turndown ratio turns directly into operating cost. The rectifier contributes to it: a conventional thyristor unit runs at 96–96.5% at full load but 92–93% at 30%, adding 0.1–0.2 kWh/kg. Where a wide modulation band is genuinely required, a switch-mode supply holding above 95% from 20% to 100% pays for itself; see our guide to DC power supply and rectifier design. Cooling behaves the same way: at 30% electrical load heat rejection is still 40–45% of design because voltage does not fall proportionally, so the chiller runs far below its efficient range — a common cause of short cycling, discussed in generator cooling system design.
Buffer Storage Sizing: The Arithmetic
When cycling is the chosen strategy, the tank is sized from the demand profile, not from a rule of thumb. The governing relationship is the maximum cumulative deficit between generation and consumption:
V (L) = [ (Qpeak − Qgen) × tpeak ] ÷ CFAC × 1.2
Q in kg/h of available chlorine, t in hours, CFAC the product strength in kg/L (0.12 for 12%), and 1.2 a margin for decay, level-control deadband and dosing-pump suction.
Worked example — municipal plant. Peak demand 12 kg/h for 4 hours a day, 4 kg/h for the other 20 hours; average 5.3 kg/h. Option A: a single 12 kg/h generator modulating down to 4 kg/h — a 3:1 turndown, inside the honest continuous range, needing no storage beyond the usual 24-hour product tank. Option B: an 8 kg/h generator flat out through the peak and cycling off-peak. The deficit is (12 − 8) × 4 = 16 kg of available chlorine, which at 120 g/L occupies 133 L. With margin, 160 L — yet the installed tank will be 500–1000 L, because it must also satisfy dosing-pump submergence, level-instrument deadbands, a minimum batch for quality testing and a sensible interval between fills. The theoretical volume is trivial; the practical volume is not.
Worked example — power station. 20 kg/h in summer, 3.3 kg/h in winter, a 6:1 seasonal swing. A single 20 kg/h train would spend seven months below 40% load, paying the part-load penalty and drifting toward 9% product. Two 10 kg/h trains with lead/lag rotation plus 10 m³ of storage to cover a train taken offline for acid cleaning deliver far better part-load behaviour for a modest capital premium. The redundancy logic is in N+1 redundancy design.
The constraint nobody plans for: ageing. A 12–15% solution loses roughly 1 g/L of available chlorine per day at 25 °C — about 0.8% per day — while chlorate accumulates. Holding time therefore has an upper bound: keep product turnover under 7–10 days, so a buffer large enough to smooth a monthly swing fails on quality long before it fails on hydraulics. Tank design is covered in sodium hypochlorite storage tank design, the downstream side in dosing system design.
Control Architecture That Makes Load-Following Work
A wide turndown ratio is worthless without a control scheme that uses it deliberately. Four layers do the work:
- Demand calculation (feedforward). Treated flow from a magnetic flowmeter multiplied by dose setpoint gives the required kg/h directly. Feedforward responds before the residual moves; feedback alone always lags by the contact-tank residence time.
- Feedback trim. A downstream residual chlorine or ORP analyzer trims the setpoint slowly — typically ±10–15% authority and a 5–10 minute integral time — so analyser noise never drives the rectifier.
- Ramp and dwell limits. Current ramps at no more than 10–15% of rated value per minute, so a full-range swing takes 6–10 minutes. Minimum run time of 20–30 minutes and minimum off time of 10–15 minutes prevent the short cycling that shortens membrane life and stresses the rectifier.
- Level override. Product tank level sits above the demand signal: high level forces turndown or stop, low level forces full output. Without this interlock the plant either overflows or runs dry.
Brine feed must follow current proportionally — a ratio controller slaved to the rectifier, not a fixed setpoint — and the brine flowmeter must stay above its minimum measurable velocity (about 0.3 m/s) at the lowest load, which sometimes argues for a smaller dedicated meter. Accumulate amp-hours per train in the PLC; that is the fairest basis for rotating lead/lag duty and predicting membrane replacement. Integration detail is in SCADA and IoT integration.
Specifying Turndown in the Purchase Order
Because the sodium hypochlorite generator turndown ratio is easy to claim and hard to verify, it belongs in the technical schedule with numbers attached. The clauses that prevent disputes:
- Guaranteed minimum continuous load in kg/h, with the associated current density, cell voltage, current efficiency, product strength and chlorate concentration — not a bare ratio.
- Rectifier type and efficiency curve at 100%, 75%, 50% and 30% load, including power factor at minimum load.
- Ramp rate (A/min) and the minimum run/off times built into the PLC as delivered.
- Turndown of every component in the chain: brine metering, anolyte circulation, cooling control valve, hydrogen dilution air, and each flowmeter’s minimum measurable flow.
- Part-load factory acceptance tests at 100%, 50% and the guaranteed minimum, measuring product strength and chlorate, not just capacity. Protocols are set out in commissioning and acceptance testing.
State the demand profile in the enquiry too. Vendors size to the peak by default; a curve sitting at 35% for six months should prompt two trains or a buffer instead of one oversized stack.
Three Reference Cases
6 kg/h municipal plant, southern China. Ratio 2.2:1 from temperature and tourist season. Single train, continuous modulation, control floor at 45% of rated output; product 12–13%, chlorate 0.6–0.9 g/L. No buffer beyond a 24-hour tank.
24 kg/h power plant cooling water. Ratio above 6:1. Two 12 kg/h trains with lead/lag rotation every 720 running hours and a 10 m³ lined tank; one train at 55–60% in winter, both near design in summer. Membrane interval extended from 3.5 to 5 years against the single-train arrangement first proposed.
3 kg/h food plant sanitation. Ratio near 8:1 on two shifts. One train cycles 4–6 times a day at full current into a 2 m³ tank, 30-minute minimum run and 15-minute minimum off times. System energy 3.7 kWh/kg against 5.1 for the modulating alternative.
Frequently Asked Questions
Is a 10:1 turndown ratio realistic for a membrane generator?
Not as continuous modulation. A stack held at 10% of rated current sits far below the current density needed for acceptable efficiency, and product strength falls to 7–8%. A 10:1 span is achievable when the generator cycles at design current into buffer storage, and that is how such claims should be read.
Does running at low load damage the membrane?
Sustained low load does not destroy a membrane, but it accelerates chlorate formation and raises specific energy. Repeated full-range thermal cycling is the more damaging pattern; local drying from over-reduced anolyte flow is the one truly irreversible failure.
What is the most economical way to handle a 6:1 profile?
Two smaller trains with lead/lag rotation, each running between 50% and 100% load, plus enough storage to isolate one train for cleaning. It beats both a single oversized train and a single small train with a large tank in almost every case we have modelled.
Conclusion
Turndown is not a marketing number — it is the intersection of a rectifier’s control range, a cell’s current-density window and a plant’s hydraulic minimums, and the lowest of the three sets the real limit. QINGY membrane generators in the 1–15 T/D range are specified and tested against a declared minimum continuous load with performance attached, so a 3:1 or 4:1 figure means the same thing in the contract as it does in service. Get the demand profile right, choose between modulation, cycling and staging on the numbers, keep continuous operation in the 50–100% band wherever the duty allows, and hold buffer volume to a week of turnover.
To have your demand curve assessed against a membrane generator configuration — with a part-load energy and chlorate estimate at your actual operating points — send the profile to sales@qingyau.com, or review the sizing method in chlorine demand calculation and generator sizing.